
America’s Housing Market
National Operators: A Tool in America’s Housing Toolkit
The current housing crunch was created by an imbalance in the supply and demand of available homes, fueled by bank lending and tightened credit standards that have made qualifying for a mortgage incredibly difficult for everyday Americans.
Since the Great Financial Crisis, the U.S. has fallen behind on the construction of new homes, while demand for the space, amenities, and quality neighborhoods that single-family homes can provide, continue to climb.
While America’s housing ecosystem is vast and diverse, the supply-and-demand imbalance of today’s housing market indicates that more opportunities, innovation, and investment are needed across all of the market’s housing types.
State of the U.S. Housing Market
The housing market is a core pillar of the American economy contributing 15% of American GDP and supporting millions of jobs across all 50 states.[1]
In 2022, full-year housing sales were 5.95 million, they are projected to 6.1 million in 2023.[2]
The current 30-year fixed mortgage rate is 6.7%, and projected to rise to 11.03% by the end of 2023.[2]
House prices have grown 10.4% in 2022, with further increases in 2023 projected to be 5%. The national average median sale price has increased by 15.4% to $424,146 year-over-year.[3]
Over the past 15 years, the number of renter occupied housing units has increased by almost 10 million.[4]
The U.S. homeownership rate in 2021 was 65.5%. Since 2016, the homeownership rate has only risen by 2.8%.[5]
The Rental Market is a Pillar of the US Economy
Breakdown of U.S. Housing Market by Leased vs Owned

Share of Homeowners vs Share of Leaseholders
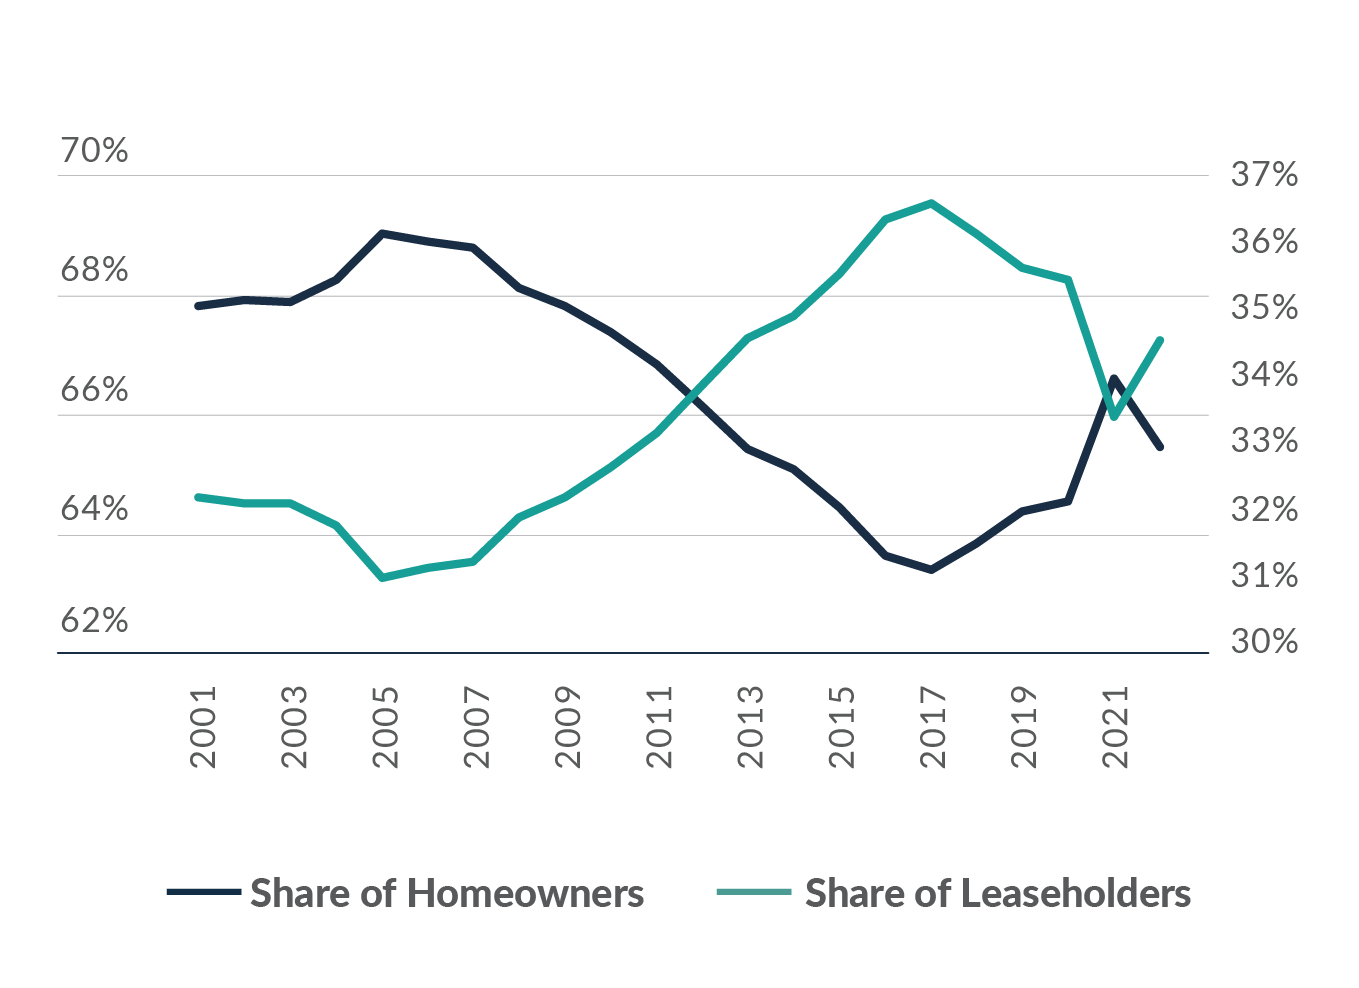
Source: US Census Bureau; 1990, 2000, 2010, American Community Survey 2010, Urban Institute estimates and Green Street Advisors
A Decade in the Making: Lack of Housing Options Nationwide
Tightened Credit Accessibility Limits Housing Accessibility
Over the past 15 years, around 650,000 low FICO purchase borrowers have lost access to the mortgage market every year, meaning over 9 million residents were essentially shut out of homeownership in the aftermath of the Great Recession and the consequences of the constrained mortgage lending that followed.[10]
Today, over 60% of purchase money mortgages go to borrowers with credit scores above 700, over 80% to those with scores above 660. This means that the average credit score of a Millennial would not qualify for the average priced home.[11]
In 2022, mortgage rates increasing from 3% to 7% boxed out 24 million American households from a $400,000 mortgage – meaning the pool of potential buyers has shrunk by nearly 50% since the end of 2021.[12]
Over the same period that the home purchase market becomes farther out of reach for everyday Americans, household formation and demand for space continues to grow.
Mortgage Originations by Credit Score
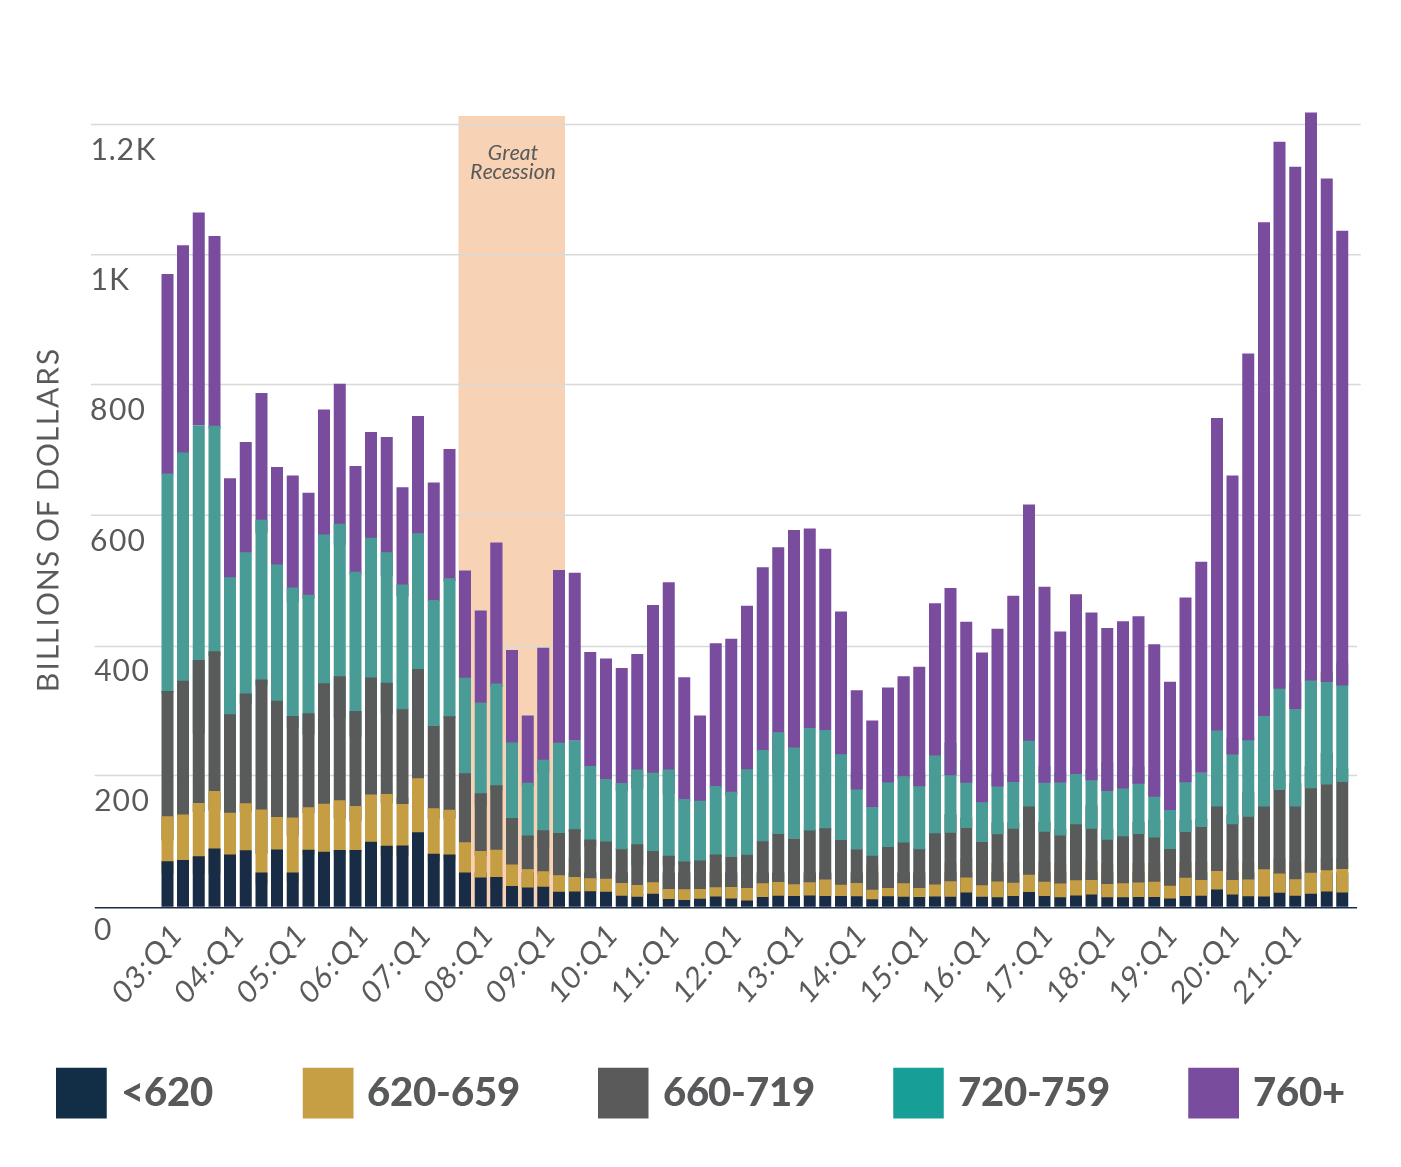
Source: Credit Score is Equifax Riskscore 3.0
Share of Homeowners vs Share of Leaseholders
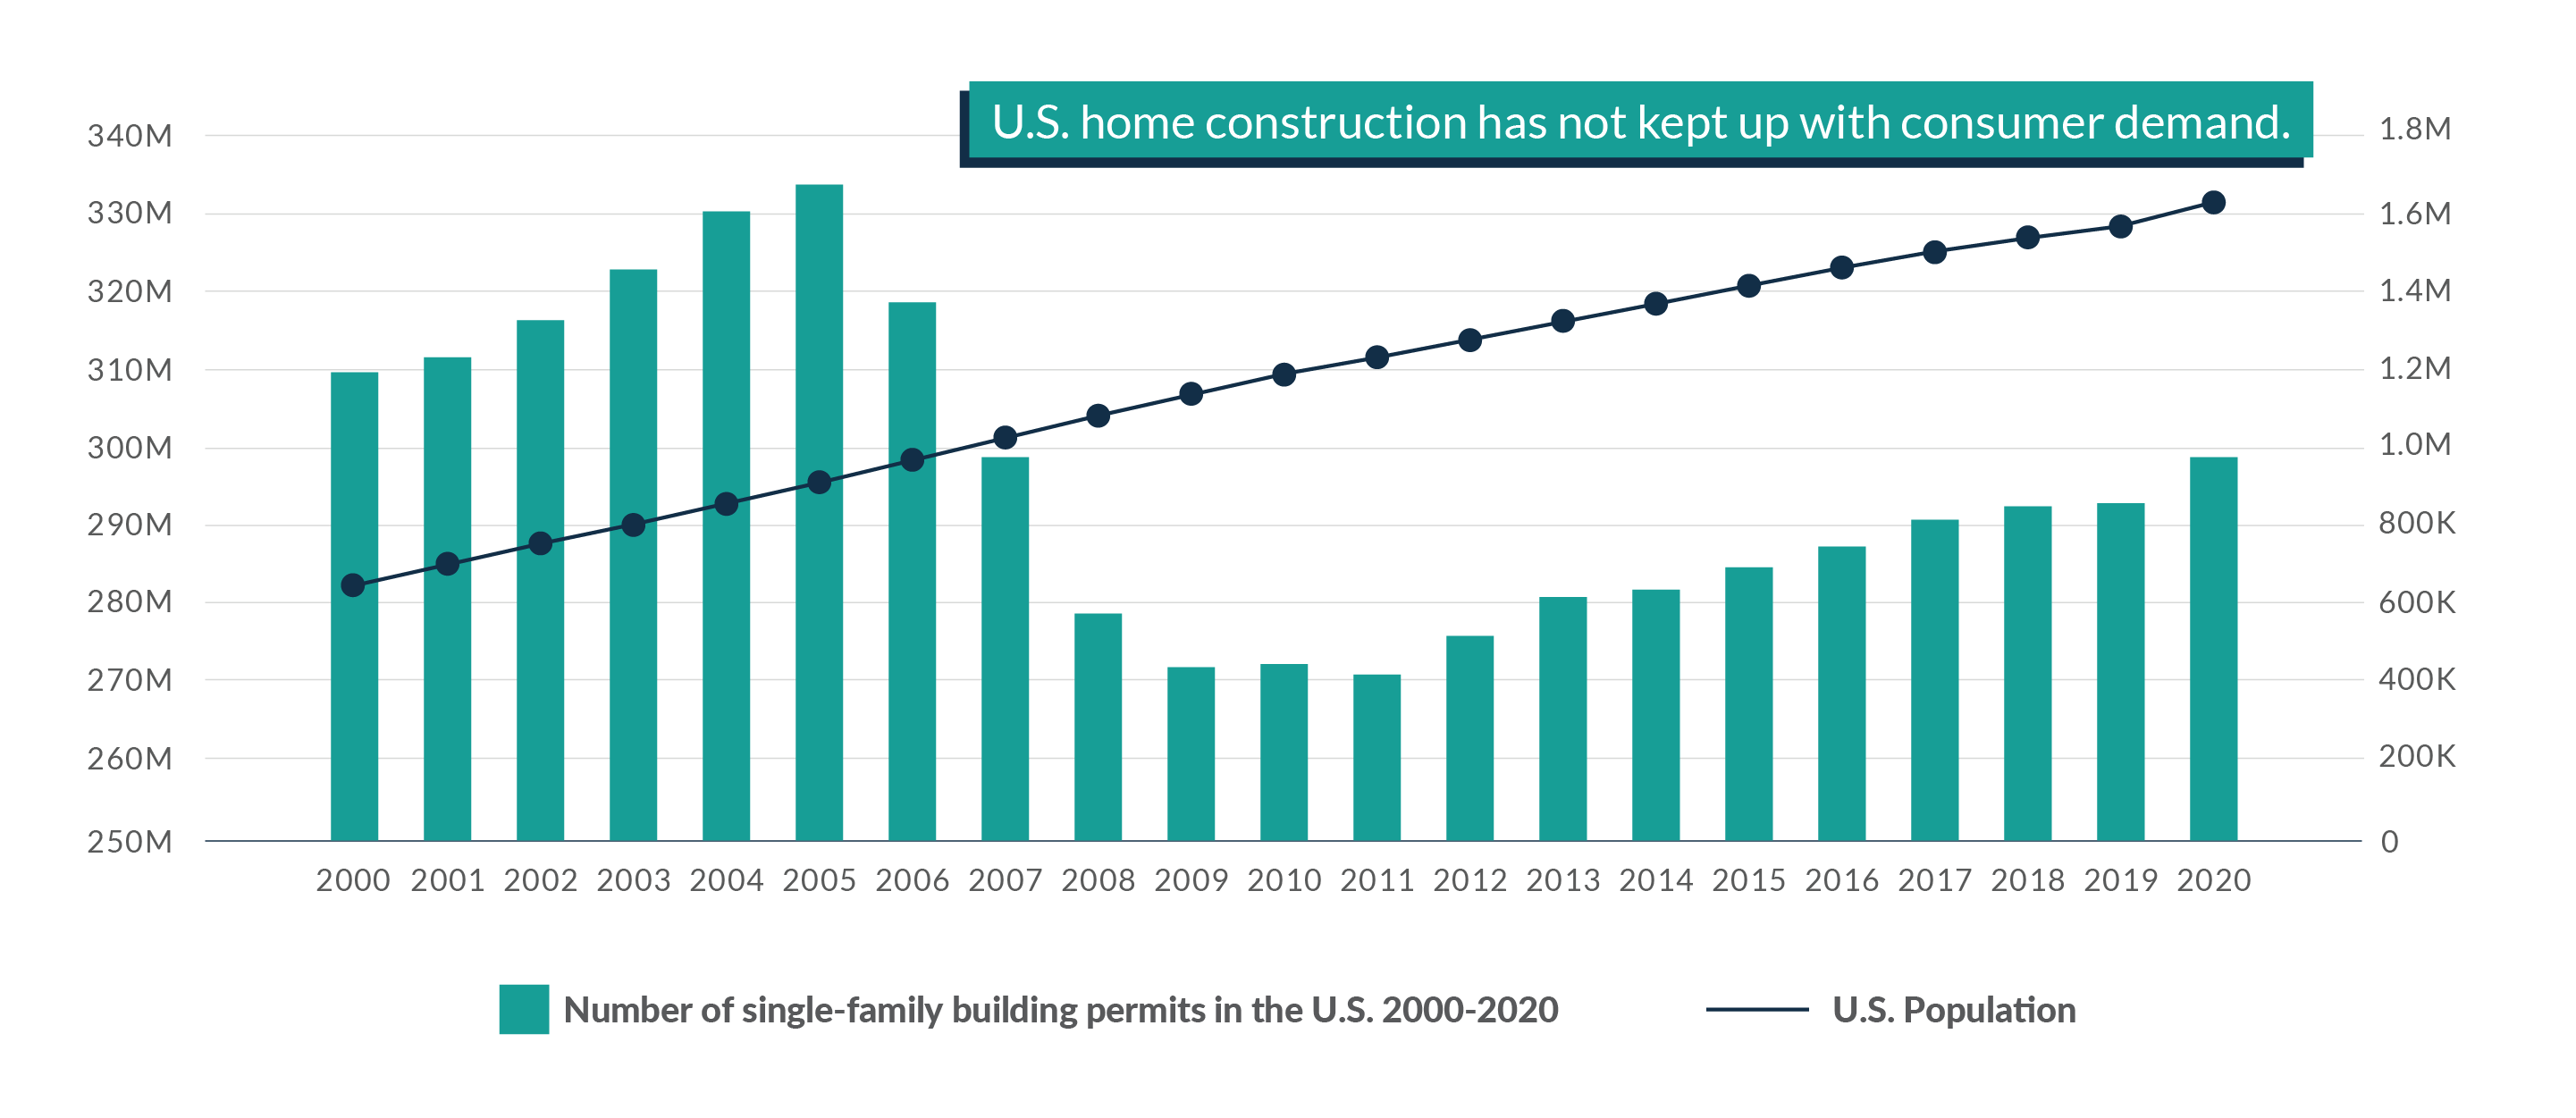
Underbuilt & Underinvested: Lack of Livable Housing Supply
The U.S. housing market is vastly underbuilt. At least 5 million more homes are needed for supply to catch up to current demand. This shortage is especially acute for rental housing – single-family rental inventory is at historic lows.
Immediately after the Great Financial Crisis, new home construction plummeted by more than 70%, and has to recover. New home construction is still at about half of pre-Financial Crisis levels.
Home construction is very sensitive to interest rates and consumer buying power – higher interest rates and less consumers with access to mortgage credit means less homes being built. The homes that are built are constructed at higher price points where homebuilders know buyers can secure a mortgage.
The slowdown in new home construction has led to a limited, aging housing stock in need of significant renovation to remain livable: the median age of U.S. housing is 40 years old.[14]
Home construction in the U.S. is also dependent on the ability to overcome the costs of federal, state, and local regulations. This regulation accounts for nearly 26.9% of the final home price – about $93,000 per home on average.[15]
U.S. Population vs. Single-Family Building Permits from 2000 to 2020 [16]
National Operators: A Tool in the Toolkit
America’s housing market is vast and diverse, the current imbalance in supply and demand means residents need more housing choice across all housing types. Renovated managed homes for lease, owner-occupied single-family homes, family-owned rental homes, manufactured housing, and multi-family communities of varying sizes, all deliver their own vital housing service in communities.
National operators are just one, incremental tool in the nation’s housing toolkit for expanding housing opportunities for families and preserving neighborhoods.
Individuals and professional management companies alike have leased single-family homes to families for decades. Over the past 15 years, the percentage of single-family homes for lease has consistently been 15%-20%.[17]
Of homebuyers who bids were not accepted, 28% lost the bid to an individual investor and 71% to another owner-occupant buyer.[18]
Over 40% of single-family renters chose to lease their home because it was more affordable and provided more convenience, flexibility, and access to a better neighborhood. Nearly one in five renters said they had no plans to own a home in the future.[19]
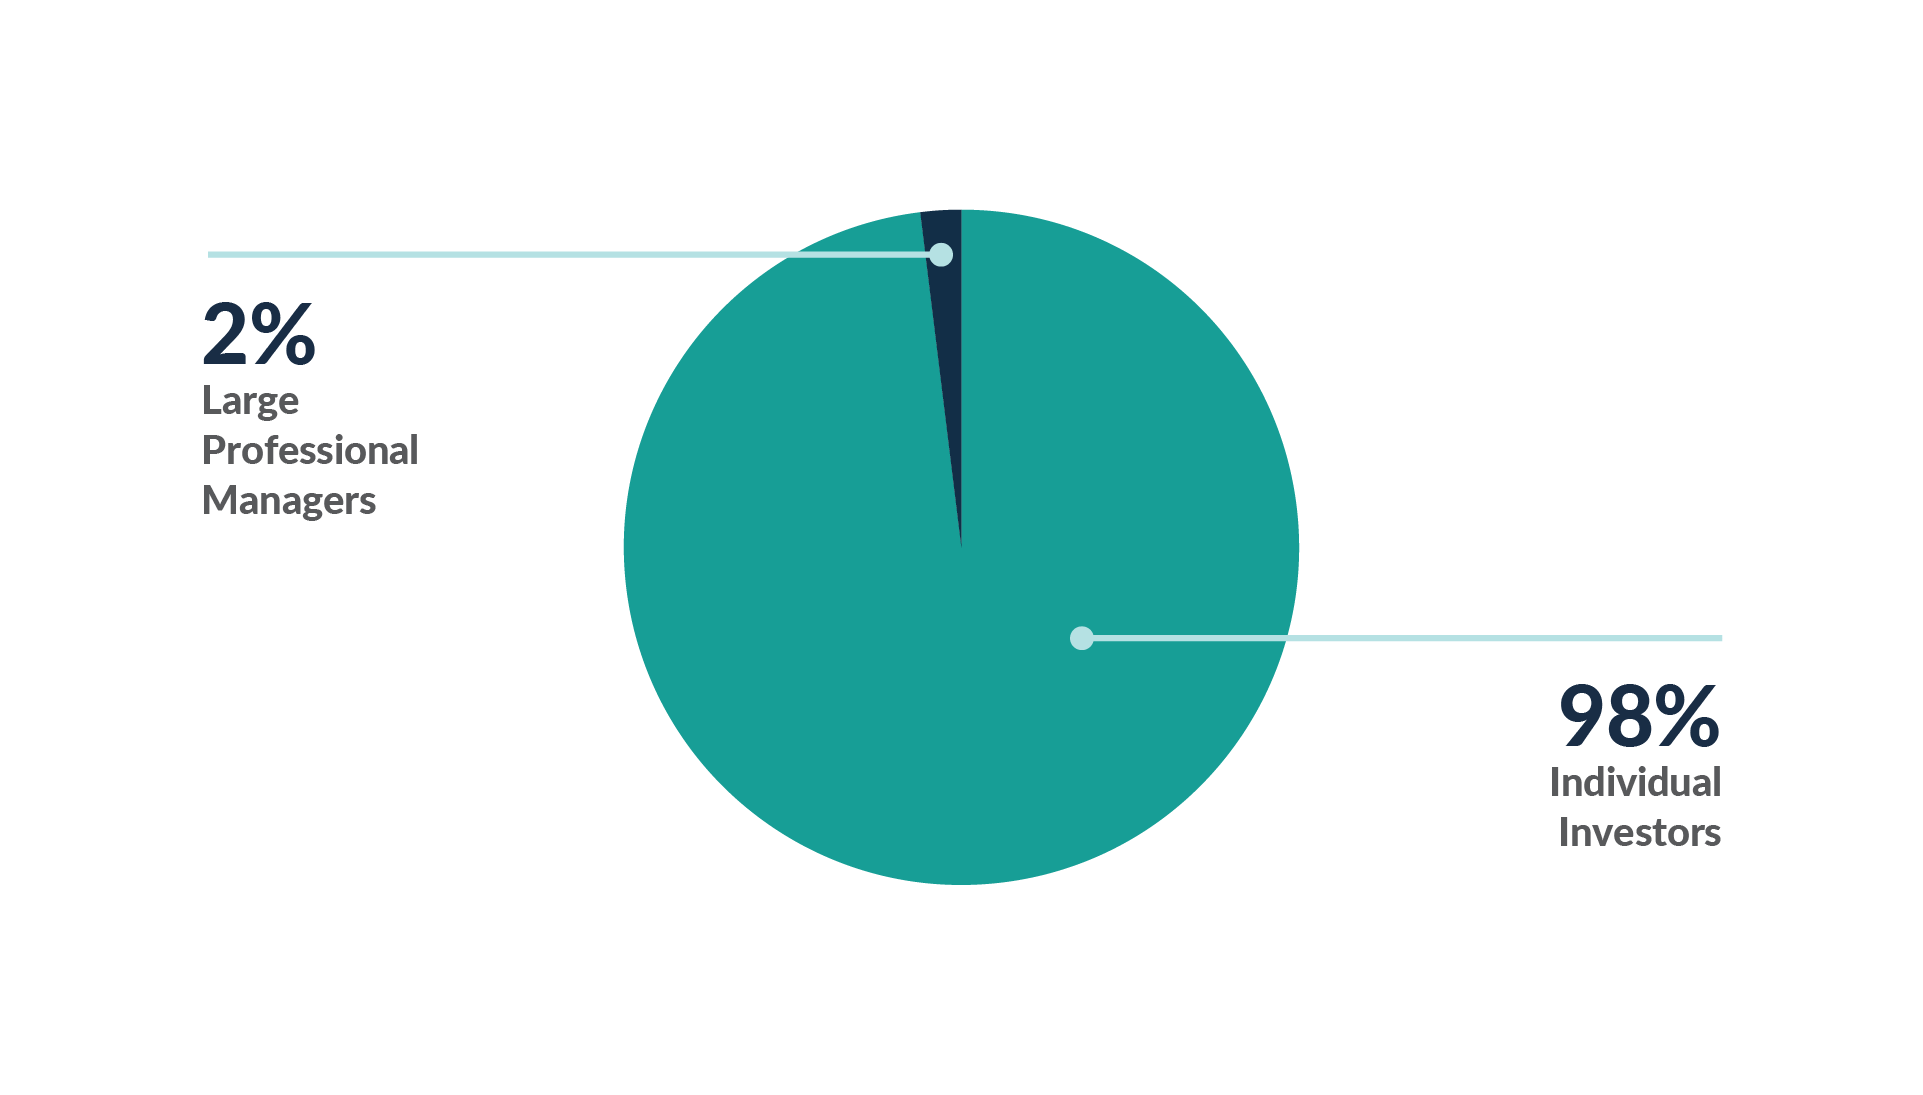
Of the nearly 16 million single-family homes for lease in the U.S., only about 350,000 are owned by large professional managers. More than 15 million – or 97% - are owned by individual investors.[20]
National operators invest in aged housing stock nearing dilapidation: 86% of the homes Amherst purchases need more than $25,000 in immediate repairs, with 42% requiring more than $45,000. None of the homes Amherst purchases require less than $10,000 in renovations.[21]
The extensive renovation work by national operators combats blight in communities, which in turn increases nearby property values and reduces crime in communities.[22] This incremental, stabilizing force national operators play generates billions in local economic growth over time and subsidizes property tax bills for homeowners in the community.
In contrast, homeowners tend to spend around $6,300 on renovations.[23] For low-income homeowners, these repairs eat up nearly 20% of their incomes on average, and the lowest income homeowners spend almost nothing annually on repairs as they cannot afford it. This means their largest investment in their lifetime slowly falls into disrepair and loses value over time.
Preserving this naturally occurring affordable housing enables communities to maintain their existing housing stock and provide community access to residents that cannot secure a mortgage.
Breakdown of Single-Family Homes for Lease Market [20]
Home Ownership Rates are Stable
Homeownership Rate in the United States from 1990 to 2021
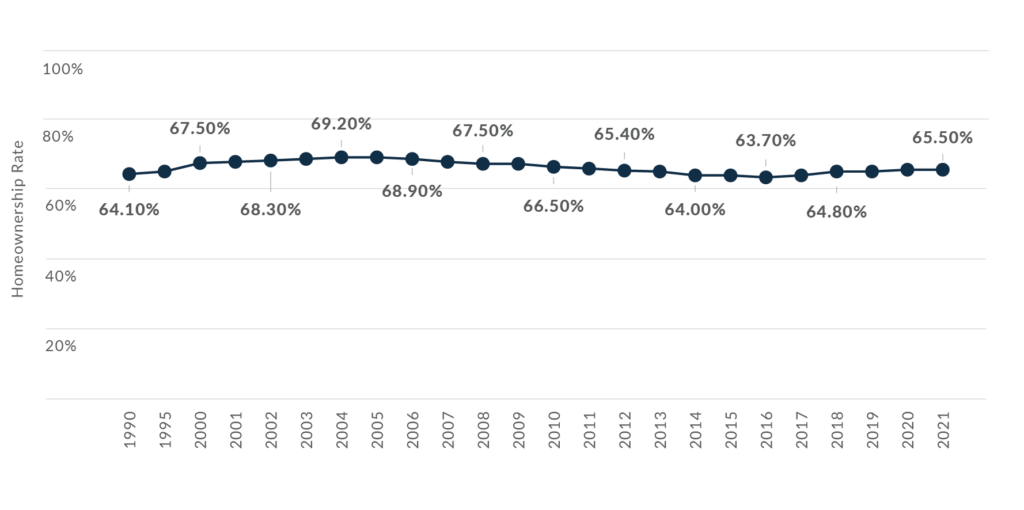
Source: US Census Bureau; © Statista 2022 Additional Information: United States: US Census Bureau; 1990 to 2021; end of 4th quarter each year
Access & Affordability of Mortgage Credit
Mortgage Originations by Credit Score
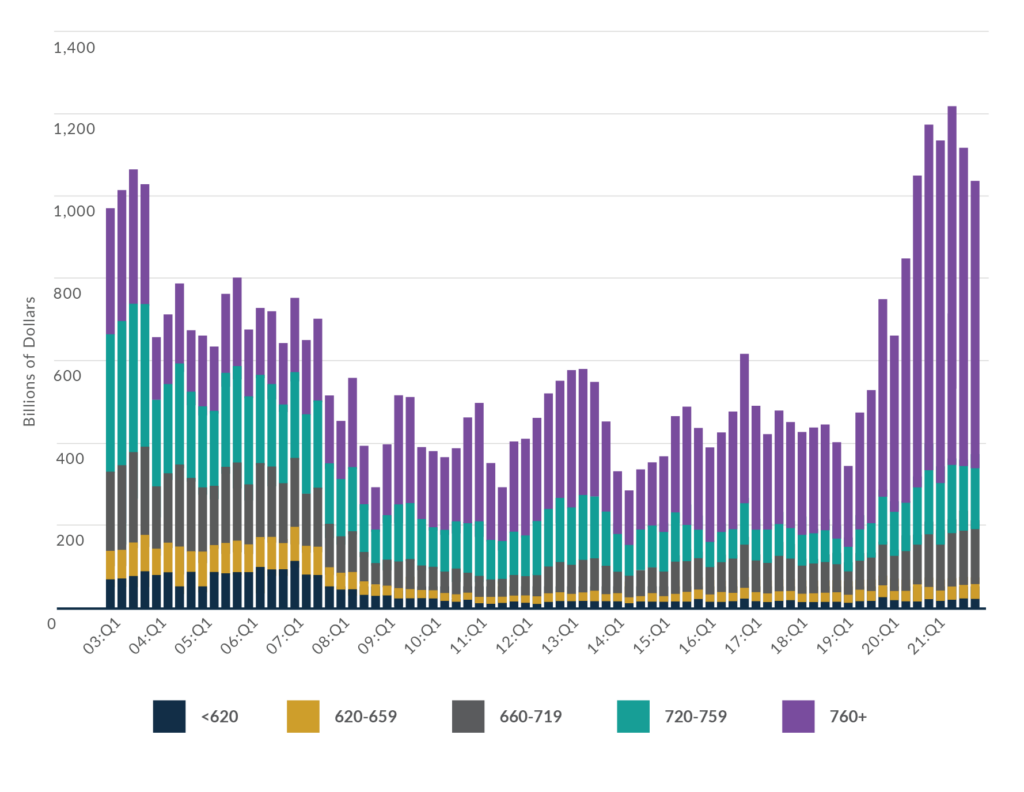
Source: Credit Score is Equifax Riskscore 3.0
Mortgage Payments, Interest Rates and Loan Size
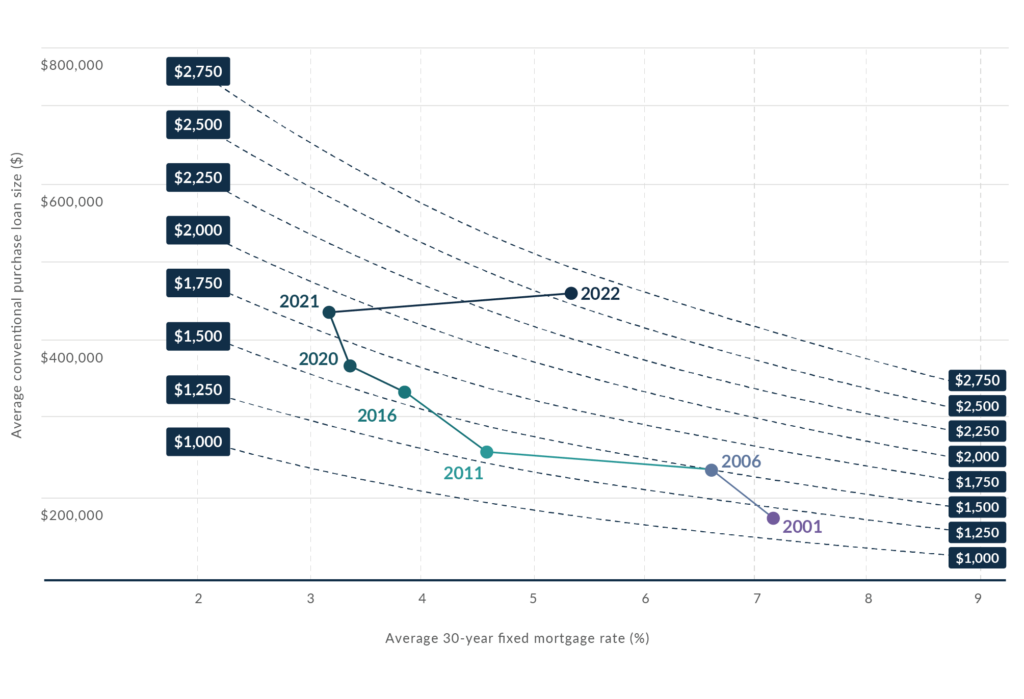
Dotted line shows equal payment combinations of rate and loan size Each dot value for week 22 of the year (latest week available in 2022)
[1] National Association of Homebuilders ‘Housing’s Contribution to Gross Domestic Product’ data as of Q2 2022
[2] U.S. Economic Outlook: February 2022, National Association of Realtors via Statista http://bit.ly/3RI2x1g
[3] Freddie Mac House Price Index price appreciation from 2010 to 2023, Statista, April, 2022. http://bit.ly/3XhCgrU
[4] U.S. Department of Housing and Urban Development, Office of Policy Development and Research Surveys National Housing Market Summary Q4 2021, page 16 and US Housing Market Conditions Q3 2006, Page 29
[5] U.S. Census Bureau Housing Vacancies and Homeownership data as of Q1 2022, https://bit.ly/3K0rJhw
[6] U.S. Census Bureau, http://bit.ly/3loMSYv, published by Statista Research Department, Number of housing units in the United States from 1975 to 2021
[7] Zillow US Housing Market Research, http://bit.ly/3XeW6Ur, January 27, 2022
[8] HUD PD&R National Housing Market Summary Q4 2021, page 15, https://bit.ly/3xcoI68
[9] U.S. Census Bureau via http://bit.ly/3jIfLi1, published by Statista Research Department, Number of renter occupied housing units in the United States from 1975 to 2021
[10] Amherst Estimates based on HMDA, Mortgage Origination Data from various sources
[11] https://www.amherst.com/wp-content/uploads/2021/11/Profile-of-Single-Family-Renters.pdf
[12] The Profile of Single-Family Renters and the Barriers to Homeownership that Got Them Here,” Amherst, November 2021.
[13] John Burns Real Estate Consulting, November 2022
[14] https://eyeonhousing.org/2022/06/the-aging-housing-stock-5/
[15] Georgia Public Policy Foundation, “Government Regulation in the Price of New Home: Georgia”, January 2022 http://bit.ly/3HDM3T6
[16] Source: U.S. Census Bureau data, via https://www.statista.com/statistics/240267/number-of-housing-units-in-the-united-states/ and https://www.census.gov/data/tables/time-series/dec/popchange-data-text.html
[17] Amherst tabulation of American Community Survey issued by U.S. Census in 2019
[18] Owner and renter stock data from 1-year ACS through 20219, with 2% growth forecast for years 2020 and 2021. Investor shares are Amherst tabulated CoreLogic tax record and MLS transaction data as of May 2022.
[19] Amherst tabulated Corelogic Transactions data as of June 6, 2022
[20] Terner Center For Housing Innovation, “The Rise of Single-Family Rentals after the Foreclosure Crisis”, April 2018, https://ternercenter.berkeley.edu/wp-content/uploads/pdfs/Single-Family_Renters_Brief.pdf
[21] Amherst estimated repairs at time purchase, data as of 03/02/2022
[22] Wu, Xiao, and Xiao, Do Wall Street Landlords Undermine Renters’ Welfare?, 2020. The study specifically examines the impact on renters when institutional investors merge. The crime decrease estimates pertain to a before and after merger comparison of neighborhoods with roughly comparable institutional presence.
[23] Urban Institute, “Institutional Investors Have a Comparative Advantage in Purchasing Homes That Need Repair,” October 2021, https://www.urban.org/urban-wire/institutionalinvestors-have-comparative-advantage-purchasing-homes-need-repair